1. Introduction
The cleanliness of lubricating and hydraulic fluids is a direct indicator of equipment condition, reliability, and service life. It is commonly measured using automatic particle counters based on light extinction (LE) technology. However, this technology can produce distorted readings in certain lubricants, especially in engine oils.
Unlike hydraulic oils, engine oils —even when new— exhibit low optical clarity due to their high content of detergent–dispersant additives, ZDDP, friction modifiers, viscosity improvers, and antioxidants. Under certain conditions, these additive packages can generate micelles and colloidal aggregates that scatter the light beam inside the measurement cell, producing what the counter erroneously interprets as solid abrasive particles. The result: artificially elevated ISO 4406 codes, without the presence of actual contamination.
The effect is amplified by two relevant operational factors:
higher viscosity, which alters the flow regime inside the optical cell, and
the presence of microbubbles, which act as light-interfering elements.
Both increase signal noise and reduce measurement repeatability, generating overcounting even in virgin lubricants.
Within the FMS engineering group, we have documented these phenomena in multiple field and laboratory evaluations, particularly during initial particle counting of engine oils under ISO 4406. These observations support the need to apply adjusted interpretation criteria and, when appropriate, complementary verification techniques.
This document presents the technical analysis developed by FMS on the mechanisms of optical interference in engine and hydraulic oils and establishes clear guidelines for interpreting ISO 4406 results with greater reliability and technical rigor.
2. Interference of Additives in
Automatic Optical Counters
Certain additives, primarily silicone-based antifoaming agents, generate significant interference in automatic optical particle counters operating on the light extinction principle. These compounds form micelles or insoluble colloidal structures, referred to as “soft particles,” which the counter’s sensor erroneously records as solid contaminant particles.
2.1. Technical Interference Mechanism
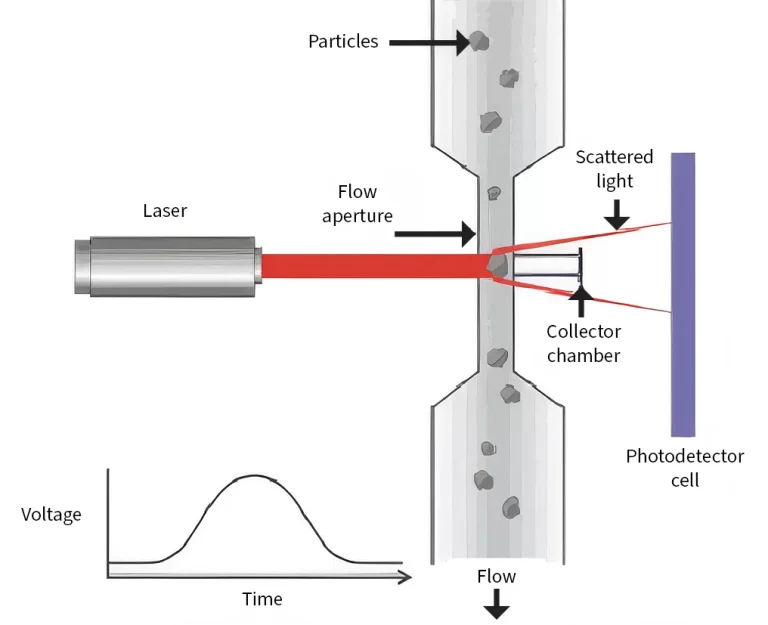
Operation of the optical sensor: Light extinction (LE) particle counters detect the attenuation of a light beam caused by the passage of a particle. The voltage drop in a photodiode is proportional to the projected size of the particle.
Nature of the interference: Antifoaming additives and other surfactants form structures (micelles, droplets, encapsulated microbubbles) with a refractive index different from that of the base oil. The sensor cannot distinguish between the light scattering/absorption produced by a hard abrasive particle (silica, metal) and one of these “soft particles.”
Consequence: “Phantom” or artificial counts are generated, particularly in the ranges of ≥4 µm(c) and ≥6 µm(c), according to ISO 4406:2021.
2.2. Quantitative Impact on ISO 4406 Codes
Low concentrations of antifoaming agents (on the order of 100 ppm) can raise the reported ISO code by several levels (e.g., from 16/14/11 to 19/17/13).
This phenomenon leads to an overestimation of the actual level of solid contamination, which may result in unnecessary maintenance actions, such as excessive filtration of a new or in-service oil, with the associated risk of removing essential additives.
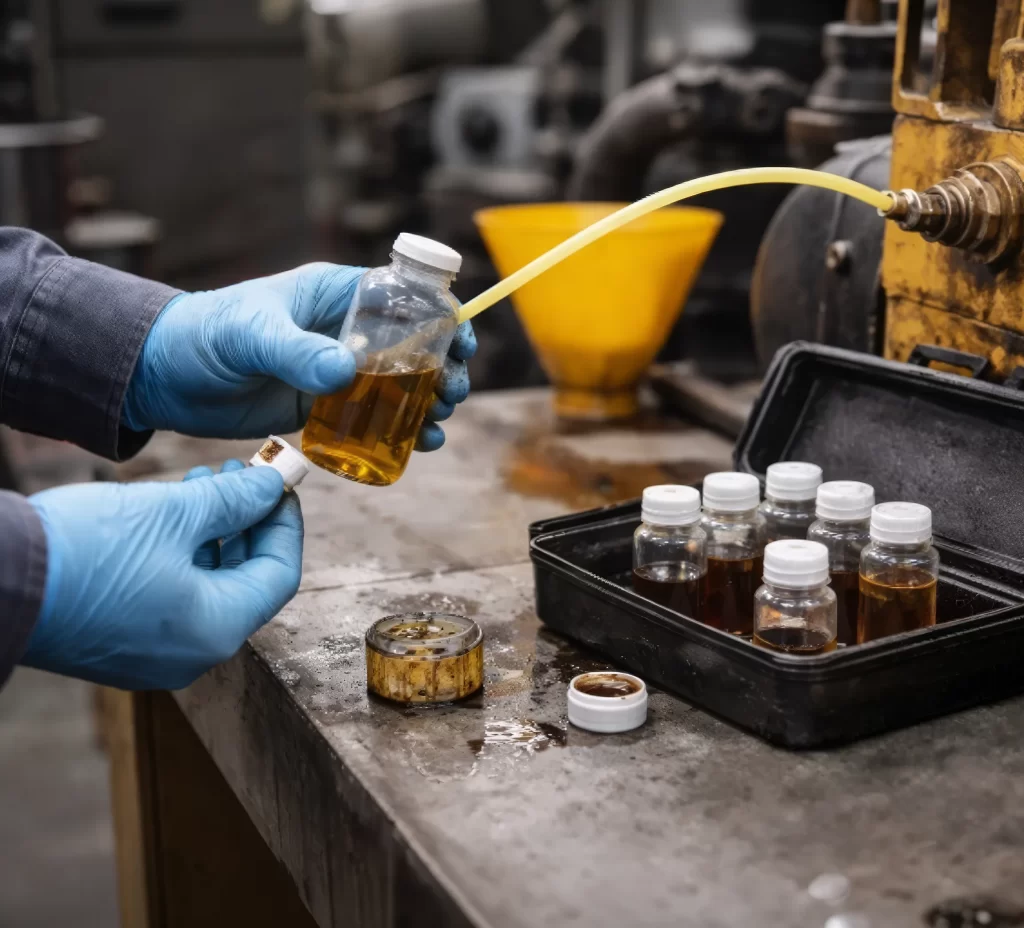
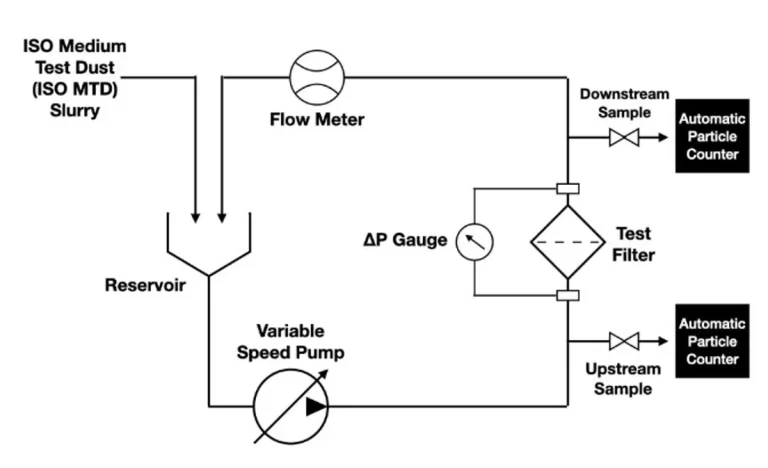
3. Dilution Method (ASTM D7647)
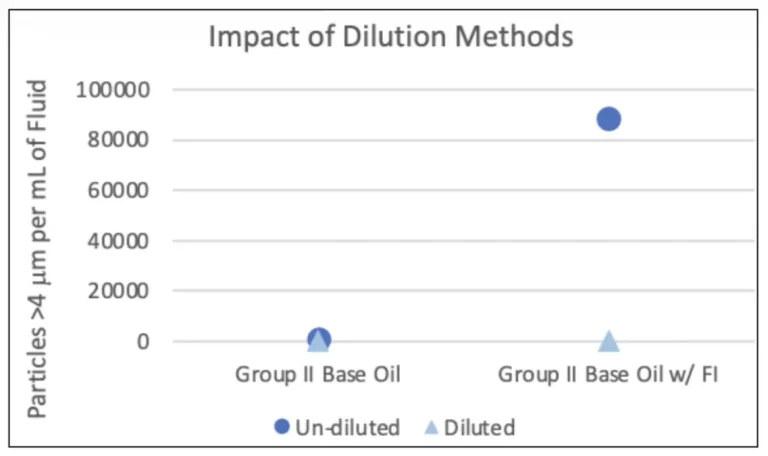
This is one of the most widely used methods to validate cleanliness codes and rule out the presence of phantom measurements. This standardized procedure consists of diluting the oil sample with an ultrapure solvent (generally an aliphatic hydrocarbon) at a defined ratio (e.g., 10:1, 100:1) until suitable opacity is achieved for the LE counter.
Mitigation Mechanism: The solvent helps disperse or, in some cases, dissolve additive micelles, reducing their light-scattering effect. It also dilutes and clarifies very dark samples.
Effectiveness: It significantly reduces false counts attributable to antifoaming agents and other interfering additives.
Limitations:
High risk of external contamination during sampling and handling, since when dealing with ultra-clean fluids, as little as 0.001 g of particles can raise a sample with ISO 11/8/7 cleanliness to ISO 22/21/18, significantly altering any laboratory result.
Effectiveness may decrease with oil aging, as additives can form more stable agglomerates that are resistant to dilution.
Adds complexity and time to the analysis.
Requires a mathematical correction factor to report the final result referred back to the original sample.
Technical studies and field experience indicate that ISO 4406 codes obtained using optical methods in additized oils may not be stable over time, even in samples stored without external contamination.
Additives, especially detergent–dispersant packages and antifoaming agents, can progressively agglomerate or coalesce, forming larger structures. These are detected by the optical counter as new particles, generating an artificial increase in the code week after week.
This implies an upward trend in counts that may be due to this phenomenon and not to actual system contamination. Interpreting such trends requires knowledge of lubricant chemistry.
In extreme cases of formulation or advanced degradation, not even the dilution method (ASTM D7647) fully mitigates this effect, highlighting the need for alternative verification methods.
4. Variability Between Laboratories and Methods
The Chevron document “Particle Counting Methodology” and multiple round-robin studies (ASTM, Noria, Chevron) highlight significant variability in particle-counting results, which can be attributed to:
Fluid Factors:
Base stock type (mineral, synthetic, HVI, vegetable)
Type, concentration, and condition of additives
Viscosity grade (ISO VG) and its index (VI)
Degree of oxidation/aging
Method and Equipment Factors:
Counter technology (LE vs. DI vs. Microscopy)
Equipment calibration and maintenance (according to ISO 11171)
Sampling procedure (location, technique, cleanliness)
Use or non-use of dilution (ASTM D7647) and the solvent employed
Data-processing algorithms (especially in DI with AI)
4.1. Magnitude of Variability
Typical variability between laboratories using LE counters can reach ±40% for the same fluid.
This may translate into differences of 1 to 3 ISO codes in the final report.
Oils with a high additive content (e.g., some antiwear hydraulic oils and engine oils) show the greatest discrepancy between optical methods (LE/DI) and the reference method (microscopy).
Key recommendation: For trend monitoring of a specific machine or system, consistency is essential: same laboratory (or the same field instrument), same counting technology, same sampling and preparation procedure.
5. Practical Rules for Expert Interpretation
5.1. Before Assuming Actual Contamination
If the three ISO codes reported by the laser particle counter differ by more than 3 levels from each other, this is an almost definitive indicator of additive interference, especially in engine oils.
5.2. Verification of Stable Measurement at ≥14 µm(c)
When it is observed that the counter is able to measure the ≥14 µm(c) range in a stable manner, that reading can be used as the primary interpretation guide, even if the 4 and 6 µm ranges show optical noise due to interference.
However, for this interpretation to be valid, three mandatory technical conditions must be met:
Condition 1 — The filter must be certified under ISO 16889
The filter supplier must be requested to provide the ISO 16889 certificate, specifically verifying:
β4(c) (ideally β4 ≥ 1000)
β6(c)
β14(c)
Without this certification, no ISO code can be interpreted accurately, since the actual filter efficiency may differ greatly from what is claimed by non-OEM brands or “economy” filters.

Condition 2 — The difference between each code must be a maximum of 2–3 levels
Valid example: 18/16/14
Invalid example: 22/16/7
A difference of 2 code levels between each range indicates:
Actual, stable contamination
Good filter efficiency
Absence of significant interference
Knowing the ≥14 µm reading and the filter’s Beta efficiency, it is possible to infer with good accuracy what the levels at ≥4 and ≥6 µm should be, even when the counter cannot measure those sizes due to optical interference.
Condition 3 — The filter must operate at a flow rate lower than that used in the ISO 16889 test
Filters must be used at a flow rate equal to or lower than the test flow under which their Beta curve was determined.
Any flow-rate excess causes:
Passage of fine particles
Partial collapse of pleats
Temporary reduction in efficiency
False readings at ≥4 and ≥6 µm
To ensure metrological validity:
Operating flow rate ≤ ISO 16889 equivalent flow rate
This point is critical for field dialysis systems, where many transfer pumps exceed the recommended flow rate for a high-efficiency cartridge.
6. The “7 Turns” Technique
(Procedure Recommended by Filter Manufacturers)
Manufacturers of offline filtration systems such as Pall, HYDAC, Donaldson, Parker, and MP Filtri recommend an operational procedure known as the “seven-turns technique,” used especially as a practical criterion for fluid cleanliness assurance.
This method constitutes a technical cleanliness-assurance methodology applicable in scenarios where no inline measurement equipment is available, it is not feasible to send samples to a laboratory, or there are discrepancies, instability, or lack of reliability in the ISO codes obtained. Under these conditions, recirculating the total fluid volume at least seven times through an offline filtration system equipped with filters certified according to ISO 16889 and with a minimum efficiency of Beta 4 > 4000 makes it possible to practically and reproducibly ensure a cleanliness level equivalent to or better than ISO 15/13/10 according to ISO 4406.
The validity of this approach is supported by the fact that the high retention efficiency in the ≥14 µm(c) channel—considered the most stable and reliable from an optical standpoint—allows indirect extrapolation of the behavior of the ≥4 and ≥6 µm(c) channels, which are commonly affected by optical noise, aeration, additive micelles, and soft particles. In this way, effective control of the ≥14 µm(c) channel after multiple complete passes of the fluid acts as a robust indicator of overall cleanliness, even in applications where the finer channels present instrumental distortion.
Objective
Eliminate micro-cavitated bubbles
Stabilize internal turbulence
Saturate the filter media
Clean the sampling equipment
Ensure stable, laminar flow
Reduce false readings caused by air or soft particles
Procedure
Recirculate the fluid through the filter or offline circuit for 7 complete cycles.
Verify that the flow rate remains within the certified range of the filter.
Ensure absence of visible bubbles and stability of differential pressure.
Result
Reproducible readings
Significant reduction of optical noise
Consistent ISO codes
Reliable trends
Although it does not appear in ISO standards, this technique is documented in manufacturers’ technical manuals and is used in hundreds of laboratories worldwide.
Additional Integration: Engine Oils as the Main Source of Distortions
Numerous ASTM, Chevron, and Noria studies confirm that:
Engine oils are, by far, the lubricants that most affect ISO measurement due to optical interference.
Reasons
High concentrations of sulfonate and phenate detergents
High levels of succinimide and borate dispersants
Highly aggressive antifoam additives
Ultrafine soot (0.04–0.1 µm) that scatters light
Micelles that mimic hard 4–6 µm particles
Therefore, in engine oils:
The ≥14 µm channel is usually the most reliable
The ≥4 and ≥6 µm channels are often optical noise, not real contamination
Microscopy (ISO 4407) may differ by as much as 5–7 codes from the optical counter
7. Practical Implications for
Maintenance and Reliability
7.1. Critical Interpretation:
An “elevated” ISO 4406 code in a new or well-conditioned oil should not automatically trigger filtration actions or oil changes. The potential influence of additives must first be evaluated.
7.2. Selection of the Analysis Method:
For highly additized oils or when interference is suspected, prioritize the Dilution Method (ASTM D7647) or DI technologies with AI.
For definitive verification or technical disputes, use Microscopy (ISO 4407).
7.3. Risk of Over-Filtration:
Filtering a new oil based on falsely high particle counts may remove essential additives (anti-wear, extreme-pressure, friction modifiers), compromising lubricant performance and protection.
7.4. Trend Monitoring:
Establish a realistic baseline for each oil/machine type. Sudden increases in the code (e.g., +3 levels in ≥4 μm) are more indicative of real contamination than high but stable absolute values.
7.5. Communication with the Lubricant Supplier:
Consult technical data sheets or the applications engineer regarding the potential interference of the oil’s additives with optical particle counters.
8. Case Study
Effective Dialysis of a Hydraulic System and Interpretation of Codes
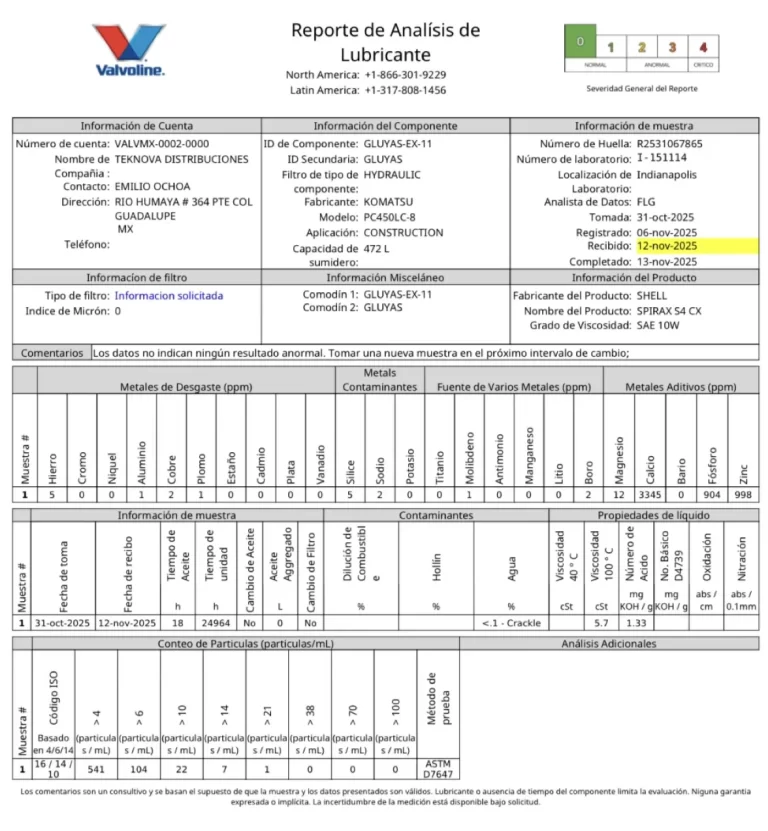
Context: Within the FMS methodology, an effective dialysis process (high-performance offline filtration) was implemented in the hydraulic system of a KOMATSU P450 heavy construction machine. The goal was to reach a target ISO 4406 cleanliness code of 16/14/10.
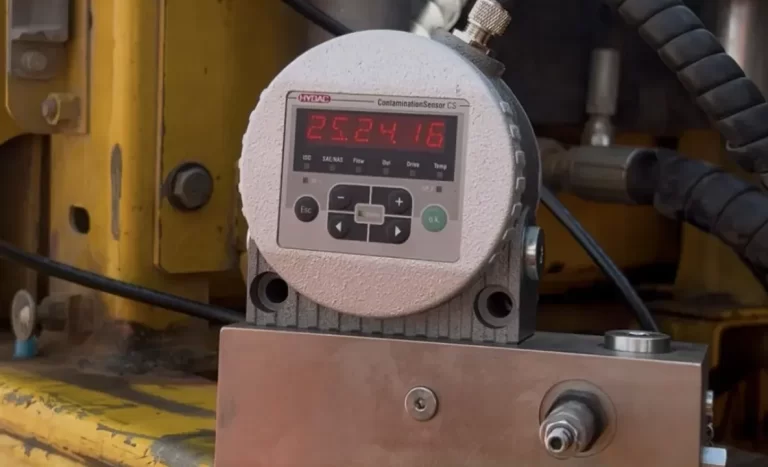
Initial Reported Code: [25/24/16] (High level of contamination).
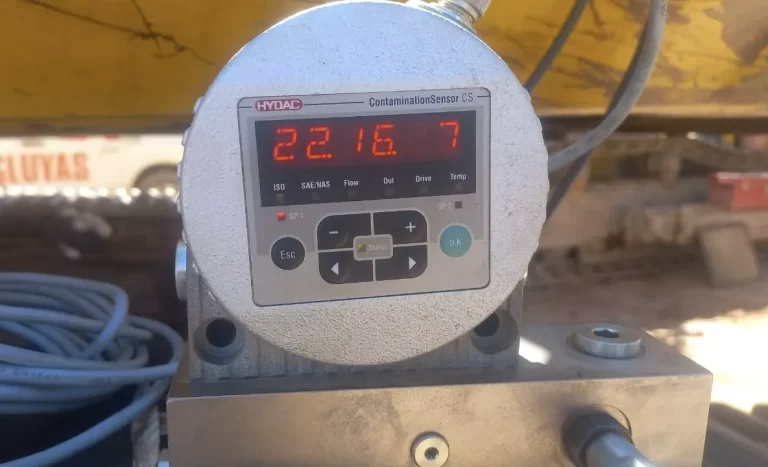
After effective dialysis: The inline laser particle counter (LE) reported 22/16/7.
8.1. Expert Analysis and Interpretation
At first glance, the code 22/16/7 appears to indicate a failure, since the target was not reached in the first (≥4 µm) and second (≥6 µm) numbers of the code. However, expert analysis reveals the following:
Discrepancy Between Codes: There is a difference of 6 codes between the first (22) and second (16) numbers, and of 9 codes between the second (16) and third (7). In a fluid with real, well-dispersed solid contamination, the differences between these codes are usually smaller (typically 1–3 codes). Such a wide gap is a classic indicator of additive interference.
Technical Interpretation:
· First code (22 at ≥4 µm): Severely inflated due to the presence of antifoam additive micelles and others, which the laser counter (LE) records as “particles” in this size range.
· Second code (16 at ≥6 µm): Also affected by additives, but to a lesser extent, since additive structures that simulate larger particles are less frequent.
· Third code (7 at ≥14 µm): This is the key indicator. A code of 7 at ≥14 µm is exceptionally low (fewer than 5 particles per 100 ml) and indicates absolute cleanliness of the fluid in the range of larger, more damaging particles. It is virtually impossible to have such a low code at ≥14 µm if significant real solid contamination were present.
Expert Conclusion: The inline laser counter was mostly reporting additive “noise” in the smaller size ranges, masking reality. The fluid, in terms of hard wear particles and abrasive contamination, was already exceptionally clean.
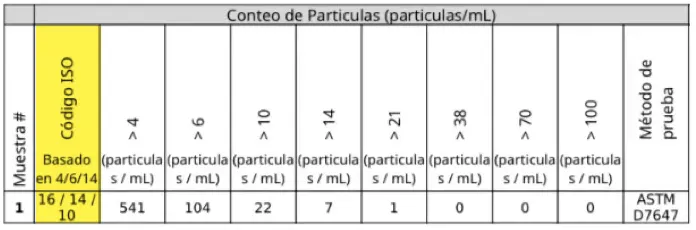
Verification: A sample of the fluid was sent to a laboratory for analysis. The result confirmed that the fluid had effectively reached the target code of 16/14/10, validating the expert interpretation.
8.2. Lessons Learned
Intelligent interpretation of ISO 4406 codes goes beyond simply comparing numbers. It requires understanding the internal coherence of the code and the measurement technology used.
For critical processes such as kidney-loop filtration, the use of online particle counters is invaluable; however, the data must be interpreted by personnel trained in the limitations of the technology.
In doubtful cases, microscopy is the ultimate arbiter for making maintenance decisions based on reliable data.
9. Conclusion
Modern lubricants and hydraulic fluids, with their complex additive packages, present a challenge for traditional optical particle-counting techniques. Additive interference, particularly from antifoam agents, can generate deceptively high ISO 4406 codes, potentially leading to incorrect maintenance actions.
It is essential that reliability, maintenance, and lubricant analysis professionals:
Have an in-depth understanding of the principles and limitations of particle-counting technologies (LE, DI, Microscopy).
Select the appropriate analytical method for the type of oil and the decision that must be made, prioritizing mitigated methods (ASTM D7647) or advanced methods (DI with AI) for additized fluids.
Interpret the data critically, looking for coherence in the results and using reference methods (microscopy) for validation when necessary.
Maintain consistency in trend monitoring for each asset.
The correct evaluation of fluid cleanliness is a cornerstone of mechanical reliability. Achieving it requires not only measurement equipment, but also expert technical judgment to transform raw data into actionable and trustworthy information.
REFERENCES
[1] Noria Corporation, “Particle Counting – Oil Analysis 101,” Practicing Oil Analysis Magazine, 2002.
[2] Noria Corporation, “The Low-Down on Particle Counters,” Practicing Oil Analysis Magazine, Jul-2002.
[3] J. E. Tucker, J. Reintjes, M. D. Duncan, T. L. McClelland, L. L. Tankersley, A. Schultz, C. Lu, P. L. Howard, T. Sebok, C. Holloway, and S. Fockler, “LaserNet Fines Optical Oil Debris Monitor,” in Joint Oil Analysis Program International Condition Monitoring Conference, 1998.
[4] ASTM International, “ASTM D7596-14 Standard Test Method for Automatic Particle Counting and Particle Shape Classification of Oils Using a Direct Imaging Integrated Tester,” West Conshohocken, PA, 2014.
[5] P. W. Michael, T. S. Wanke, M. a. McCambridge, S. Tung, B. Kinker, M. Woydt, and S. W. Dean, “Additive and Base Oil Effects in Automatic Particle Counters,” J. ASTM Int., vol. 4, no. 4, 2007.
[6] P. W. Michael, Benz oil, and T. S. Wanke, “Surgically Clean Hydraulic Fluid – A Case Study,” in International Fluid Power Exposition and Technical Conference, 1996.
[7] J. Sander, S. Mauritz, T. Smith, J. Turner, and S. Courtney, “The Effects of Lubricant Ingredients on New Hydraulic Oil Cleanliness,” J. ASTM Int., vol. 6, no. 1, 2009.
[8] Chevron ISOCLENA Certified Lubricants, “Technical Bulletin: Impacts of Filtration on New Lubricant Performance,” Richmond, CA, 2021.
[9] ASTM International, “ASTM D7647-10 Standard Test Method for Automatic Particle Counting of Lubricating and Hydraulic Fluids Using Dilution Techniques to Eliminate the Contribution of Water and Interfering Soft Particles by Light Extinction,” West Conshohocken, PA, 2018.
[10] Rocky Mountain Filtration Solutions, “Fluid Cleanliness Comparison Guide,” Commerce City, CO
[11] ASTM International, “ASTM D7669-15 Standard Guide for Practical Lubricant Condition Data Trend Analysis,” West Conshohocken, PA, 2015.